
Plant Diary
Plant Diary
Botanical observation & nature exploration.
I’m from Shanghai, China.
I am interest in Economics, Environmental Science, Applied Mathematics and Statistics.
I am looking forward to meeting you.
My Email: angelaszzh@gmail.com

Botanical observation & nature exploration.

Home for business & economics enthusiasts.

Exploring the dilemma between economy and environment.

An edutainment game to improve environmental awareness.

Community service and cross-group connection.
Applying academic knowledge to real-world problems.
Fieldwork
A four-day rural investigation in southern Shaanxi — meeting villagers, recording wildlife, and presenting findings on sustainable tourism.



Click any card to read the document in-site.
Exploring Nature

One day while walking down the school’s hallway, I spotted cracked soil on the ground. A bamboo shoot was coming out of the soil, just like Excalibur being pulled out from the stone in the legend of King Arthur. The bamboo’s dark brown sheaths were like layers of fish scales that wrapped tightly around the inside shoot, forming a sharp contrast with the tall, green bamboos nearby. Over the next few days, I slowed down each time passing by and squatted for a closer look. The sheaths gradually split open layer by layer from the bottom up along the stem, with dry edges curling outward. Rainwater accumulated in the folds between layers and didn’t evaporate until the temperature rose in the afternoon. In just one week, the shoot grew up to 1.8 meters with an incredible speed.
This unexpected finding sparked my curiosity. I joined the school’s Flower & Plant Service Team, carrying a notebook and camera to explore the campus whenever I had free time between classes, at lunch, or after school. The willow trees by the pond had dark brown barks covered with longitudinal cracks, rough and wrinkled like an elder’s hand. The photinia bushes beside the playground were covered with white flowers, emitting a distinctive pungent smell during the flowering season. The Buddhist pine beneath the classroom building had leathery leaves that spread outward like the sharp spines of a hedgehog.
I also saw gardeners working hard multiple times. Lawns overgrown with weeds were trimmed neatly every month; flower pots at the school gate were replaced with fresh flowers as seasons changed; pothos in offices were regularly moved outside to receive sunlight. I realized that the beautiful and lively campus scenery does not happen by chance — someone has always been caring for it behind the scenes.
Beyond observing plant morphology, I noticed subtle changes that can be easily missed. Hydrangeas growing in different parts of campus bloomed in different colours. I compared and recorded soil conditions at each site and discovered a pattern: blooms turned blue and purple in acidic soil and pink in alkaline soil, and a single flower could even show mixed colors. A cactus on the art classroom’s windowsill caught my eye: its petals opened and closed many times within one day. I visited it continuously over several days, recording the exact times its petals unfurled and folded back. It turned out that the flower opened fully on bright, sunny days and curled inward in the evening as the temperature dropped. Shifts in light also influenced its cycle of opening and closing.
I recorded my observations in a plant diary alongside the photos I took, hoping to bring more attention to the plant life surrounding us every day. Starting from the volunteer team, I encouraged peers to step outside and observe campus greenery. I combined our separate notes to expand and improve the note. To attract more students, I added the cultural value of plants into my diary. For example, the Chinese word for kumquat sounds similar to the word for good fortune. Pomegranate’s abundant seeds symbolize reunion and prosperity.
More students began to join. Members of school’s TV station took photos around campus and turned plant scenery into postcards. Students from the biology club collected fallen flowers and leaves to make specimens, which they later displayed and sold at campus fairs. My plant diary has been passed down to new students, who continue to add their own observations. The campus truly grew into a harmonious home shared by humans and plants.
Research
My current research interests focus on the financial implications of sustainability and on mathematical modeling of environmental questions.
Empirical study · U.S. public firms, 2002–2018
Environmental, Social, Governance Performance and the Cost of Debt
This study examines the relation between ESG performance and the cost of debt. The sample consists of 9,763 firm-year observations for U.S. public firms over the period 2002–2018. The research applies baseline regressions with firm-level controls, year and two-digit SIC industry fixed effects, alongside cross-sectional analysis, ESG pillar analysis, endogeneity tests and robustness tests.
The main finding shows that higher ESG scores are associated with lower loan spreads. This negative relation is more pronounced among small-sized firms and loss-making firms and is primarily driven by the governance pillar of ESG.
Keywords: ESG performance; loan spread; cost of debt; corporate governance.
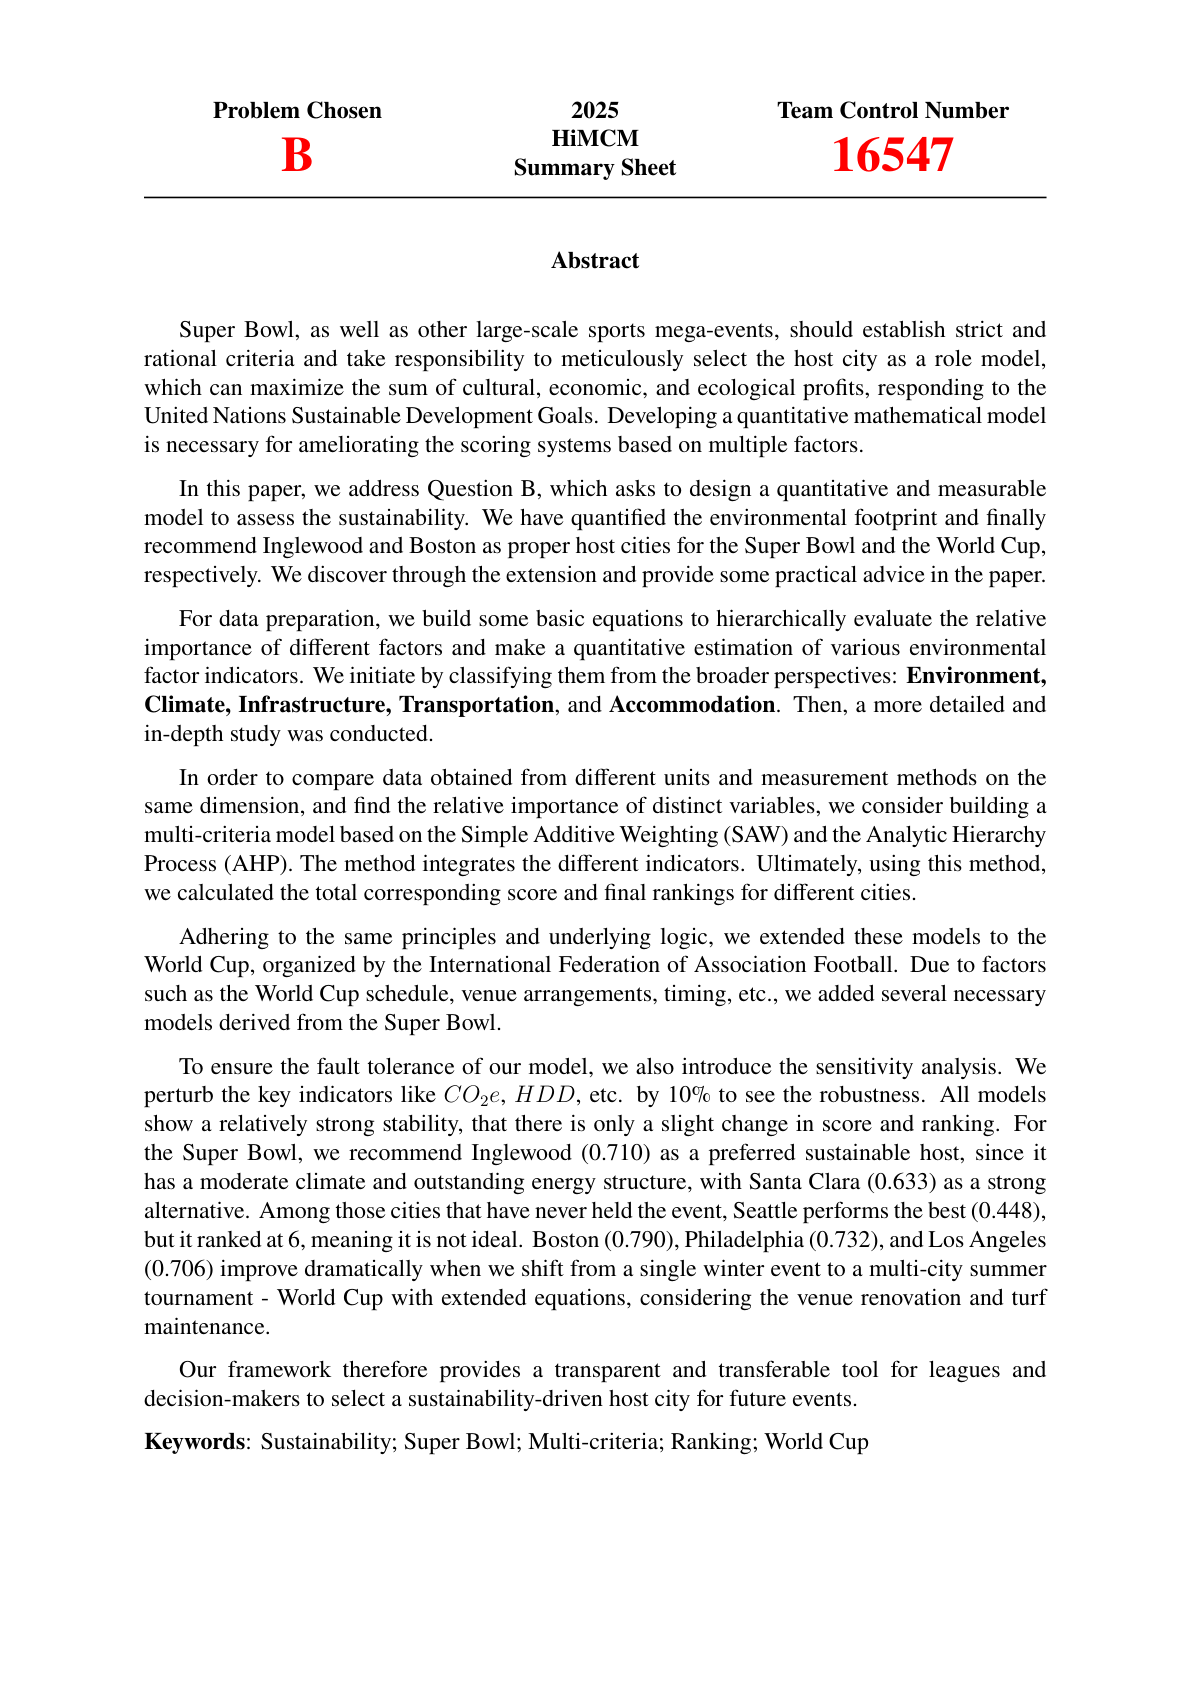
Mathematical Contest in Modeling · Team #16547
This problem is from the contest of 2025 HiMCM (High School Mathematical Contest in Modeling) – Problem B: Environmental Impact of Sport Mega-Events
As we grow more concerned about sustainability, large-scale sporting events or sport mega events like the Super Bowl are being made more environmentally responsible. External organizations have developed models and scoring systems to rate the sustainability of these large-scale events based on many factors from energy use and waste management to transportation and carbon offsets.
The Consulting Organization Making Athletics Planet positive (COMAP) has hired your team as sustainability consultants to assess and reduce the environmental footprint of sport mega-events. The goal is to understand the ecological impact of these events and explore how changes in event planning could make a difference.
- Understand the Problem. Investigate the environmental impact of hosting a sport mega event using 2025 Super Bowl LIX in New Orleans, USA as a baseline.
- Create Your Model. Create a model to determine where to hold the next Super Bowl based completely on environmental concerns. When building the model, teams should consider what drives environmental impact and how location specific characteristics can make a difference. Keep in mind that your model may be qualitative or quantitative.
- Apply Your Model. Determine which city should host the Super Bowl in 2029, the next year currently without a confirmed location.
- Expand Your Model and Reflect on Your Analysis.
- Share Your Model and its Results. Write a one-to-two-page letter to the NFL recommending your chosen host city for the Super Bowl in 2029. In your letter, persuade the organization to accept your choice by highlighting the environmental advantages associated with your proposal. Be specific about why your top choice stands out and how it aligns with sustainability goals.
I led a team of four members, including myself.
Zihan Zhang Team lead
Data collecting, mathematical modeling, programming, paper writing and verification.
Meizhen Chen
Mathematical modeling, drafting “NFL Host City Letter”.
Ruoyang Huang
Illustration making, drafting Introduction & Model Assumption.
Jessica Xu
Data collecting, drafting Strength & Limitation, Conclusion.
SAGE Club


SAGE stands for Students for the Advancement of Global Entrepreneurship. As the school’s only business club, we chose this name because we hope every member can build an entrepreneurial mindset, a strong sense of social responsibility, awareness of sustainable development, and a global vision.
Our club is split into three main teams:
We have around 35–40 members each year, made up of Grade 10 and Grade 11 students. The photos above show our club group pictures from my Grade 11 and Grade 10 years, respectively. Every year, we hold two to three club-bonding events. We spend roughly 30% of our annual club revenue on these gatherings, to celebrate all the hard works our club members have done over the past year. Another 40% of our income goes toward developing new merchandise and covering production and startup costs. The remaining 30% is used to support brand-new student clubs on campus, helping them start and develop. We also donate part of these funds to off-campus charity organizations.






When I was in Grade 10, I joined the Design Team. I turn my creative ideas into finished designs that we sold around school at annual celebrations and holiday events. Some of my most successful projects include:
We also have our signature club product: campus plush bear. It is by far our most popular item and always sells out most quickly. Last year, we even expanded sales to another branch campus and built a cross-campus distribution partnership with their business club. The bears come with red, blue or green outfits — either casual T-shirts or formal suits — matching the school uniforms of each grade level. Priced at ¥65 each, 400 bears were completely sold out over one weekend during our school’s open-day.


I created this board game ahead of our annual club festival. I aim to draw more students to our SAGE stall and keep them engaged. I redesigned a map of our school as the game map, turning real campus buildings into purchasable properties. I added fun, school-themed surprise events on special squares. For example, landing on our campus snack shop “Sweet Hut” lets players enjoy a snack bonus; getting caught during a dorm check-in means you have to stay still until the punish time period ends.
I worked with local suppliers to produce the physical board, print event cards and rulebooks. Different-colored Lego blocks represented each player. Within just one hour, more than 100 students stopped by to play, and the game got positive feedback. The full set of game rules is in the attached document above.
After I entered Grade 11, I took on the role of Academics Team Lead. I wanted to pass on what I had learned from my AP Microeconomics and Macroeconomics classes, as well as my hands-on experience from outside competitions including IEO, NEC and BPC, to younger students in our club. I created a ten-session lesson series covering game theory, risk-taking decisions, behavioral economics and other economic topics in real life.
During these classes, we also played my Campus Monopoly Game. This helped our members fully understand how the game worked, so they could confidently explain the rules and answer visitors’ questions at the club festival. It was incredibly joyful to watch my teammates grow — many started out only curious about economics with very little background knowledge, and slowly learned how to connect economic concepts to everyday life. That experience showed me how meaningful it can be to share knowledge with others.
Volunteer


I have volunteered at Shanghai Library East Branch and Shanghai Library Huaihai Branch since 2025. During this past winter vacation, I was assigned to the children’s section by library staff. As the Lunar New Year was approaching, the library held a woodblock rubbing activity. I happened to have experienced this traditional Chinese craft earlier, during a school farm-study trip to Chongming Island, so I was already familiar with the whole process. My job was to guide young kids print festive patterns to welcome the new year.
The process of woodblock rubbing is as follows.
We offered black and gold ink. The gold ink faded quickly and often produced blurry, incomplete prints. Most visitors in the children’s section were under 10 years old, and nearly all of them preferred the bright, eye-catching gold color. Hoping to give them a wonderful experience, I tested several different types of paper. Eventually I found that paper napkins worked best — this highly absorbent material held the gold pigment far better. After switching materials, the prints turned out much clearer, and I could see how happy the kids were. Kids had small hands and lacked the strength to hold the board steady while rolling the brayer. So I held the board for them and repair prints that came out faint. In total, I helped over 100 children discover the charm of this traditional craft.



Books at Shanghai Library are shelved by categories — for example, D stands for politics-related books and J stands for art books. Readers often struggle to locate books when they are unsure which category the book falls into. When visitors felt confused, I showed them how to use the library’s book-search website: type in the book title, check whether it was available or lent out, then head to the right shelf after obtaining each book’s unique serial number. Even with clear directions, readers still met problems. Sometimes shelf numbers skipped between levels. Other times readers reshelved books in the wrong spot. In those cases, I helped search for missing books, sometimes books were in the book-return cart, other times I checked records and found books were at different floors.
Beyond book searching, I assisted readers to use the borrowing machines. One common confusion was that the children’s section only had a borrowing machine, with no returning machine. Many people showed up trying to return their books, so I directed them to the correct return location. I also explained library borrowing rules: the standard loan period is 28 days, renewable for up to 56 days total, late returns incur fines, and each person may borrow a maximum of 15 books before having to return older ones...
Whenever new users came to borrow books, I taught them patiently through every step. I also handled unexpected issues from time to time — expired QR codes for borrowing, blocked accounts from overdue books, or repaying fees for lost books. In these situations, I transmitted their concerns to more experienced library staff so that problems could be solved properly. Altogether, I assisted roughly 800 library visitors. Spending time with children and supporting readers helped me understand what being a volunteer truly means: showing genuine kindness to everyone around me.



Apart from these front-end tasks, I also took part in the works behind scene to support the library’s internal operations. At the Huaihai Branch, I worked in the storage room. My role was similar to a delivery worker. I received book request scrips sent by fax, located these books by the call numbers, and placed each book with its scrip into a small transport cart. The cart then travelled through the library’s internal conveyor system to deliver books to the correct floor, so readers could pick them up without walking across the whole building. I transported more than 100 books in total. This job gave me insight into the daily routine of library employees. While the repetitive work could feel tedious sometimes, I found it worthy in serving others and improving the local community.
Edutainment Game




After taking the environmental science course at school, I came to see how closely humans are connected to the Earth. I began to notice many unsustainable habits in daily life, such as excessive food waste in school cafeterias and peers leaving lights and air-conditioners on in empty classrooms. Although terms like carbon emissions and carbon neutrality are well known, most people still don’t have the awareness to turn these environmental ideas into real-life action. To make a change, I decided to take a novel approach: creating an edutainment game to transform environmental science into a world that players can explore and reshape.
The idea for designing a game originated from my volunteer work at Shanghai Library. My responsibility was guiding young children through woodblock rubbing activities, a traditional Chinese craft, to welcome the New Year. As I interacted with kids, I witnessed their intense curiosity about the mechanics behind printmaking. They were surprised when they obtained delicate horse patterns from wooden planks, asking endless questions about how rollers and ink boards created such vivid pictures. This process made me realize that simply lecturing children about cultural or scientific knowledge can hardly catch their attention. Without playful participation, they would quickly become bored and distracted. Game serves as a powerful tool to attract audiences and make knowledge accessible.
I began incorporating renewable energy and ecological concepts I learned in environmental science class into my game. For example, after discovering that biofuel generates far fewer CO2 emissions than coal, I created a farm-themed scene where players collect cow dung to produce biofuel. Based on the knowledge that mangrove forests provide vital ecosystem-regulating services, I designed a plot where players protect mangrove habitats by clearing litter and caring for resident wildlife. I developed a 6-stage gameplay where players can protect forests, accumulate carbon assets, and trade them strategically to experience a simplified version of the real-world carbon market.
I searched real-world data and built up some formulas to support the scoring mechanism of this game:
To make the game appealing to children, I used pixel art as the game’s art style. Factories and banks appear as friendly patterns rather than the serious buildings in realistic scenes. Since most people live in cities nowadays, the scene of farms and factories may seem unusual. I wish that the contrast between cities and countrysides can attract them to explore further and learn the lifestyle of countryside, which is to live in harmony with nature.
I established a publicity team of 15 people to bring this game to schools, corporations and communities, spreading carbon finance knowledge to more people. During promotion, we received plenty of feedback and suggestions from players of different backgrounds and made corresponding improvements.
Zihan Zhang
Email: angelaszzh@gmail.com / Tel: +86 13681855102
放个人网址
Education Background
No.2 High School of East China Normal University 2024.9-2027.6
School Courses: Chinese, Maths, English, Chemistry, AP Calculus BC, AP Environmental Science, AP CSA, AP Macroeconomics, AP Microeconomics, Politics, History, Geography, Sports, Arts
AP scores: Microeconomics 5, Macroeconomics 5, Calculus BC 5, Environmental Science 5, Statistics 5, Chemistry 5, CSA 4, US History 4
GPA: 4.14/4.19
TOEFL: 111
SAT: 1590
Academic Experience
Scientific study about environmental impact with finance tools (ongoing) 2026.6-2026.9
FISF Future Financier Summer Camp - Fudan University, School of Finance 2025.7
Think like an economist - Fudan University, School of Economy 2025.3-2025.6
Financial Courses 2025.7-2025.8
Community Service
School SAGE Club (Business Club), Co-leader 2024.9-2026.6
School Flower & Plant Service Team 2024.9-2026.10
Campus Open Day & Fun Fair Volunteer 2024.9-2025.12
Carbon Account Campus Promotion Program 2025.7-2026.6
Shanghai Library Volunteer 2025.7-2026.8
Extracurricular Activity
Fieldwork in Ningshan County 2026.7
Carbon Reduction Mini Game 2025.7-2026.8
AI Gesture-Controlled Scenic Navigation Application 2024.10-2024.11
AI-Powered Nucleic Acid Testing Site Optimization System 2022-2023
Honors & Awards
This study examines the relation between ESG performance and the cost of debt. The sample consists of 9,763 firm-year observations for U.S. public firms over the period 2002-2018. The research applies baseline regressions with firm-level controls, year and two-digit SIC industry fixed effects, alongside cross-sectional analysis, ESG pillar analysis, endogeneity tests and robustness tests. The main finding shows that higher ESG scores are associated with lower loan spreads. This negative relation is more pronounced among small-sized firms and loss-making firms and is primarily driven by the governance pillar of ESG. This work adds to existing literature on ESG and private debt costs and offers practical implications for lenders and corporate managers.
The United Nations Global Compact first defines environmental, social and governance (ESG) in a 2004 report titled “Who Cares Wins” as a variety of non-financial criteria which are used to evaluate companies’ performance and inform investment decision-making. Recent years, ESG has became more and more popular in business and other institutions. Currently, 90% of S&P 500 companies release ESG reports. In Europe, the Corporate Sustainability Reporting Directive (CSRD) requires large companies to disclose comprehensive ESG data using the European Sustainability Reporting Standards (ESRS). Meanwhile, Sustainability reporting is now becoming mandatory for U.S. corporations, driven by state regulations and international standards like Climate Corporate Data Accountability Act (SB 253). These trends show that ESG has been essential from the aspects of manager, corporation, and even the whole society.
ESG-related metrics have grown into vital risk-pricing indicators for creditors in the loan market. Banks face long-term credit risks brought by borrowers’ operational accidents, social scandals and defective internal management. Better ESG performance serves as non-financial signals for lower downside risks, stable stakeholder reputation and mature long-term risk management. For this reason, banks take environmental, social and governance conditions into account when setting loan spreads, the key indicator of corporate borrowing expense. Exploring how ESG shapes debt pricing helps clarify the lending relationship between banks and borrowing enterprises.
Trends in ESG performance have also attracted academic attention, particularly the rationale behind the association between ESG and corporate cost of debt. There are two competing theories about ESG’s financing effect: the shareholder theory and the stakeholder theory. According to Friedman’s (1962) shareholder theory, a corporation’s top priority is to maximize firm value. Some shareholder theorists argue that large-scale ESG investment consumes corporate resources that should be allocated to high-margin profit-generating projects. Excessive spending on environmental protection, social welfare programs and corporate governance brings unnecessary financial burdens and elevates operational and credit risk. Creditors demand higher interest premiums as risk compensation. Thus, they predict a positive relation between ESG spending and a firm’s cost of debt.
In contrast, the stakeholder theory suggests that corporations should go beyond the interests of shareholders and consider the interests of a broader group of stakeholders including bondholders, banks, employees, regulators and local communities (Freeman, 1984). Jones (1995) extends stakeholder theory by indicating that ESG performance is essential for corporations in obtaining external financing resources and stakeholder support. High ESG ratings help firms mitigate legal and reputational risks, reduce information asymmetry between borrowers and creditors, lower default probability, and gain more favourable financing terms. Therefore, stakeholder theory anticipates a negative relation between ESG performance and the cost of debt.
Although numerous studies have explored the association between ESG performance and firms’ cost of debt, existing evidence remains mixed and inconclusive.
From the perspective of stakeholder theory, superior ESG outcomes help enterprises reduce borrowing costs by mitigating credit risk and information asymmetry. Raimo et al. (2021) argue that firms delivering transparent ESG disclosures are able to access external debt financing on more favourable terms from third-party capital providers. Similarly, Apergis et al. (2022) document that businesses with low ESG scores are considered to carry more downside risks, which translates into higher debt financing expenses.
On the contrary, shareholder theory proposes that expenditure on ESG occupies limited corporate resources, and such resource misallocation ultimately drives up firms’ cost of debt. Saputra et al. (2025) further highlight the moderating role of agency conflicts in this relationship. They reveal that the positive relationship between ESG engagement and borrowing costs becomes more pronounced when agency costs within the firm are high.
Apart from the two competing standpoints, several scholars suggest that neither theory alone can fully explain the ESG-debt cost linkage, and the actual outcome reflects a mixture of both theoretical predictions. Lavin et al. (2022) identify two different transmission mechanisms. In the direct channel, enhanced ESG disclosure is correlated with reduced financing costs. Nevertheless, greater disclosure may simultaneously lead to higher borrowing expenses via an indirect channel due to potential growth risks.
Moreover, some investigations fail to observe any meaningful statistical connection between ESG performances and debt pricing. Steven (2022) detects no material association between ESG disclosure scores and the cost of debt within their sample. The author indicates that fundamental firm characteristics, specifically liquidity and firm size, constitute the primary determinants of corporate borrowing costs instead of ESG performance.
However, apart from these conflicting findings, early research seldom discusses how the connection between ESG performance and cost of debt changes under different firm-level risk conditions. It remains unclear whether ESG carries stronger influence on loan pricing for small-scale firms with severe information barriers and loss-making firms under financial pressure. Many works haven’t separate the independent impact of environmental, social and governance dimensions, or compare which pillar weighs most for bank creditors. This paper fills these research gaps through baseline estimation and heterogeneity test.
The core research question of this paper is: whether higher ESG scores help companies cut their loan-spread financing cost. Three logic chains support this hypothesis. First, transparent ESG disclosure reduces information asymmetry between lenders and borrowers by releasing usable non-financial information. Moreover, ESG practices can reduce default risk by improving long-term risk control capacity. Lastly, solid ESG records can relieve agency conflicts and build positive public reputation, lowering the default risk perceived by banks.
Firm size and liquidity are important determinants of debt pricing. Larger enterprises with abundant liquidity have more comprehensive information disclosure, stable cash flow and diverse financing channels, and thus have lower credit risks. ESG performance serves only as additional supplementary information and has a relatively weak marginal impact on bond pricing. In contrast, smaller firms with insufficient liquidity face greater cash flow pressure and limited capacity to withstand external shocks. They suffer from higher expected default risk and struggle to convey operational stability through financial indicators alone. Under such circumstances, good ESG performance acts as a crucial risk-mitigating signal, demonstrating the firm’s compliance governance and sustainable operating capabilities to investors, and easing creditors’ risk concerns. Therefore, the suppressing effect of ESG on the cost of debt is more prominent among smaller, less liquid firms.
Based on the evidence we have found, this study aligns with the predictions derived from stakeholder theory and anticipates that superior ESG performance helps firms achieve lower cost of debt. Accordingly, this study develops the following hypotheses:
This study examines whether corporate ESG performance is associated with the cost of debt. Using 9763 firm-year observations from year 2002 to 2018 retrieved from the [XX] database, we estimate regressions of loan spreads on ESG scores while controlling for firm characteristics, year fixed effects, and industry fixed effects. We find that higher ESG performance is associated with lower loan spreads: a 10-point increase in ESG corresponds to approximately 1.4 basis points reduction in loan spread. Cross-sectional tests show that the relation is stronger among small-sized and loss-making firms and appears to be concentrated in the governance pillar. The findings remain broadly robust to endogeneity and robustness tests, although the ESG coefficient loses statistical significance under the strictest model.
This paper brings two main contributions to existing research. First, it provides new empirical evidence for heterogeneous ESG effects, and proves ESG information delivers greater value for firms with information asymmetry and high credit risk. Also, the paper distinguishes three separate ESG dimensions and identifies the dominant status of governance factors in bank loan pricing.
The rest of this paper proceeds as follows. Section 2 introduces data sources, variable definitions and the empirical identification strategy. Section 3 presents baseline regression outcomes and heterogeneity test results. Section 4 conducts additional analysis on the three separate pillars of aggregate ESG scores. Section 5 addresses potential alternative explanations through endogeneity test and verifies the stability of findings through robustness test. Section 6 summarizes research results and the study’s limitations.
This study assembles firm-year-level data from multiple financial databases. First, loan-level information comes from the [xx] loan spread database. ESG performance scores are obtained from the [xx] ESG rating database. The dataset supplies the aggregate ESG index and three independent sub-dimensional scores for environment, social responsibility and corporate governance. Firm-level financial control indicators are extracted from the [xx] Compustat database. It covers firm size, profitability, leverage ratio, tangibility, cash holdings, market-to-book ratio, sales growth and loss status metrics for listed enterprises. The unique firm identifier gvkey serves as the link to match loan spread records, ESG ratings and annual financial information across separate databases.
This study merges three datasets: ESG rating data, loan spread data, and firm financial data from Compustat, with sample period from 2002 to 2018. First, we combine the raw ESG dataset with an ISIN-gvkey (International Securities Identification Number-Global Company Key) link table using ISIN as the matching key. Since one gvkey corresponds to repeated annual ESG records for the same firm, we apply an m:1 merge and retain only firm-year observations with valid matches. Next, we integrate a cleaned gvkey-permno link table to attach permno identifiers to the ESG data. Third, the ESG dataset containing permno and fiscal year is merged with loan spread data on a 1:1 basis, yielding a combined sample with ESG performance and loan spread information.
After integrating all datasets, we apply sequential sample filters. We drop duplicate firm-year records to ensure one unique observation per firm each fiscal year. Then, we remove entries missing values for loan spread, aggregate ESG score and key financial controls. All continuous firm-level variables are winsorized at the 1st and 99th percentiles to reduce distortion from extreme outliers.
The dependent variable is loan spread, measured as the interest rate premium over the benchmark risk-free lending rate. It directly reflects a borrowing firm’s incremental debt financing cost and the credit-risk premium charged by banks. A larger loan spread value means higher borrowing expenses from bank loan contracts for the enterprise.
The main independent variable is ESG score, which is a composite index score of environmental, social and governance performance, with a higher value indicates stronger ESG performance. Firms with superior ESG performance can ease information asymmetry, lower perceived default risk and win favour among creditors. For that reason, we expect the coefficient of ESG Score to be negative in our baseline regression.
Following prior research, the model controls for firm size, profitability, leverage, asset tangibility, cash holdings, market-to-book ratio, sales growth, and loss status. All specifications include year fixed effects and industry fixed effects.
Firm Size: This variable equals the natural logarithm of a firm’s total assets at the end of the previous fiscal year. Larger companies usually own more stable cash flow, stronger anti-risk capacity and lower bankruptcy risk. Therefore, we predict Firm Size carries a negative correlation with loan spread.
Profitability (ROA): Measured by net income divided by total assets. Higher profitability signals robust operating performance and sufficient funds for debt repayment. We expect profitability to be negatively associated with bank-loan risk premiums.
Leverage: Calculated as the sum of long-term debt and current debt scaled by total assets. Higher leverage corresponds to heavier debt repayment burdens and elevated default exposure. Hence we anticipate a positive coefficient for Financial Leverage.
Asset Tangibility: Measured by property, plant, and equipment divided by total assets. Tangible property works as reliable collateral for bank loans and cuts down lenders’ credit losses upon default. We predict the tangible-asset ratio relates negatively to loan spread.
Cash Holdings: Represented by cash and short-term investments divided by total assets. Ample cash reserves improve firms’ short-term solvency and reduce repayment-related risk. Accordingly, we expect cash holdings to produce a negative coefficient.
Market-to-book Ratio (MTB): Computed as the sum of market value of equity and total debt, divided by total assets. This indicator captures market-based growth prospects for the enterprise. High-growth firms may face higher risk uncertainty.
Sales Growth: This variable captures the annual percentage change in a firm’s sales. Rapid sales expansion mirrors business expansion and market competitiveness. We expect growing-sales firms to obtain comparatively favourable loan pricing.
Loss Status: A binary indicator that takes the value of one if net income is negative, and zero otherwise. Loss-making businesses suffer from poor operating conditions and heightened credit risk. We therefore predict this loss indicator will bear a positive coefficient on loan spread.
Loan Spreadi,t = β0 + β1ESGi,t + β2Sizei,t + β3ROAi,t + β4Leveragei,t + β5Tangibilityi,t + β6Cashi,t + β7MTBi,t + β8SalesGrowthi,t + β9Lossi,t + Year & Industry Indicators + εi,t
Standard errors are clustered at the firm level to handle the correlations within the same company. Multiple annual observations for a single firm are unlikely to be fully independent of one another. This adjustment generates more trustworthy t-statistics for hypothesis testing.
Table 1 presents summary statistics for the main variables, reflecting basic sample distribution features. The mean loan spread is 0.009, equivalent to approximately 90 basis points. ESG score has a mean of 38.657 and a standard deviation of 19.776, indicating substantial variation across firm-year observations. The mean of the loss indicator is 0.195, suggesting that approximately 19.5% of the observations report negative net income. The variation in the dependent variable, ESG performance, and firm characteristics supports the subsequent multivariate analysis.
Table 2 reports pairwise correlations among the main variables. ESG score is negatively correlated with loan spread (ρ = -0.285, p = 0.00), providing preliminary evidence consistent with the predicted negative relation. ESG score is also correlated with firm size (0.553), while firm size is correlated with loan spread (-0.42), highlighting the importance of controlling for observable firm characteristics. The pairwise correlations do not indicate an obviously near-perfect linear relationship among the explanatory variables. Nevertheless, these univariate correlations neither control for confounding factors nor establish causality. The subsequent baseline regression therefore controls factors including firm characteristics, year and industry fixed effects.
This table reports summary statistics for the variables used in the empirical analyses. Loan spread is measured in decimal form; multiplying the reported value by 10,000 converts it to basis points. ESG score measures overall ESG performance, with higher values indicating stronger performance. Size is the natural logarithm of total assets. ROA is net income divided by total assets. Leverage is the sum of long-term debt and debt in current liabilities divided by total assets. Tangibility is property, plant, and equipment divided by total assets. Cash is cash and short-term investments divided by total assets. MTB is the sum of market value of equity and total debt divided by total assets. Sales growth is the annual percentage change in sales. Loss equals one when net income is negative and zero otherwise. Firm-level continuous control variables are winsorized at the 1st and 99th percentiles. Obs. denotes the number of firm-year observations. Observation counts differ slightly across variables because of missing values in certain firm-level indicators.
Obs.
This table reports Pearson pairwise correlations among the variables used in the empirical analyses. Correlation coefficients are reported below the diagonal, with p-values in parentheses. Loan spread is measured in decimal form, and higher ESG scores indicate stronger ESG performance. All other variables are defined in Table 1. Pairwise correlations are calculated using all available nonmissing observations for each variable pair. *, **, and *** indicate statistical significance at the 10%, 5%, and 1% levels, respectively.
This table reports OLS regressions examining the association between ESG performance and loan spread. The dependent variable is loan spread multiplied by 100 and is therefore measured in percentage points. Column (1) includes ESG score only. Column (2) adds firm-level control variables. Column (3) additionally includes year fixed effects, and Column (4) includes both year and two-digit SIC industry fixed effects. t-statistics based on standard errors clustered at the firm level are reported in parentheses. *, **, and *** indicate statistical significance at the 10%, 5%, and 1% levels, respectively.
Table 3 reports the baseline regression results. Column (1) shows a negative and statistically significant association between ESG score and loan spread. After firm-level controls are added in Column (2), the absolute magnitude of the ESG coefficient decreases from -0.0077 to -0.0019, suggesting that observable firm characteristics explain part of the raw relation. The coefficient remains negative and significant after year fixed effects and industry fixed effects are included in Columns (3) and (4). In the preferred specification in Column (4), the ESG coefficient is -0.0014 (t=-3.82). Overall, the results are consistent with the hypothesis that stronger ESG performance is associated with a lower cost of debt.
The result from Column (4) shows that a 10-point increase in aggregate ESG score is associated with a 1.4-basis-point reduction in loan spread. Given the sample-mean loan spread of 0.90 percentage points, this effect equals approximately 1.56% of the average loan-spread level. Although a 1.4-basis-point marginal effect may seem moderate, the aggregate debt-financing savings can be economically substantial when scaled by the total volume of corporate debt.
Most control variables remain their expected sign and strong statistical significance across different columns, with only modest magnitude fluctuations. Firm size produces a significantly negative coefficient: larger firms have lower loan spreads, consistent with their lower default risk and superior access to credit markets. ROA is negatively related to loan spread, meaning more profitable firms bear lower debt-financing costs. In contrast, leverage has a positive and significant coefficient, since greater liability elevates credit risk and increases loan spreads. The loss indicator also returns a positive, highly significant coefficient across all columns, supporting the hypothesis that lenders impose higher spreads on firms with negative net income.
Table 4 examines whether the ESG–loan-spread relation varies with firm size and loss status. In Column (1), the coefficient on ESG × Small firm is -0.003 and is significant, indicating that the ESG association is stronger among small firms than among large firms. The estimated ESG effect for small firms is -0.0035, as confirmed by the margins test. Column (2) similarly shows that the interaction between ESG and Loss firm is -0.0034, implying a stronger relation among loss firms. These findings are consistent with the view that ESG information is more valuable when information asymmetry or credit risk is greater, although the tests do not directly identify the underlying mechanism.
This table examines whether the association between ESG performance and loan spread varies with firm size and loss status. The dependent variable is loan spread multiplied by 100 and is measured in percentage points. In Column (1), Small firm equals one when firm size is below the sample median and zero otherwise. The coefficient on ESG score represents the ESG slope for large firms, while ESG x Small firm captures the incremental difference for small firms. In Column (2), Loss firm equals one when net income is negative and zero otherwise. The coefficient on ESG score represents the slope for profitable firms, while ESG x Loss firm captures the incremental difference for loss firms. All models include firm-level controls, year fixed effects, and two-digit SIC industry fixed effects. t-statistics based on firm-clustered standard errors are reported in parentheses. *, **, and *** indicate significance at the 10%, 5%, and 1% levels, respectively.
Overall, the baseline and cross-sectional results support the core hypothesis that superior ESG performance reduces firms’ cost of debt, and this effect is amplified for high-risk companies. Having established a robust negative association between aggregate ESG performance and loan spreads, we next examine whether this relation differs across firms and which ESG dimension contributes most strongly to the result.
While the baseline results show a negative relation between aggregate ESG performance and loan spread, the composite index may conceal potential heterogeneity across its three individual components. Environmental, social, and governance dimensions could affect lenders’ pricing decisions through distinct channels, and combining them into one single score obscures which dimension truly drives the reduction of debt-cost. Therefore, we apply additional analysis to separate the three ESG pillars to identify the primary source of the observed association.
Table 5 presents two sets of regression specifications. Columns (1) – (3) report separate-pillar models: each regression includes only one ESG pillar alongside firm controls, year fixed effects and industry fixed effects. These columns assess the unconditional correlation between each individual pillar and loan spread. Column (4) is the joint-pillar model, where environmental, social, and governance scores are included in the regression simultaneously. In this joint setup, each coefficient reflects the conditional association between one pillar and loan spread, holding the other two ESG dimensions constant.
Table 5 decomposes the aggregate ESG score into environmental, social, and governance pillars. When estimated separately, the coefficients on the environmental, social, and governance scores are -0.0004, -0.0005, and -0.0014, respectively. While all three coefficients are negative, the environmental coefficient is insignificant, the social coefficient is weakly significant at the 10% level, and the governance coefficient is statistically significant at the 1% level. When all three pillars are included jointly in Column (4), governance remains negative and statistically significant with a coefficient of -0.0014, whereas the other pillars turn insignificant. This pattern suggests that the overall ESG–loan-spread association appears to be concentrated in the governance dimension, consistent with lenders placing value on monitoring quality and lower agency risk.
This table reports which dimension exerts a stronger effect on the aggregate ESG result. Since a single aggregate ESG score is likely to mask the economic implications of different dimensions, a separate pillar regression is required. Therefore, the aggregate ESG score is decomposed into environmental, social, and governance pillars to identify which component drives the baseline negative relation between ESG performance and loan spread. The dependent variable is loan spread multiplied by 100 and is therefore measured in percentage points. All regressions employ the same set of firm controls used in the baseline analysis. t-statistics based on firm-clustered standard errors are reported in parentheses. *, **, and *** indicate significance at the 10%, 5%, and 1% levels, respectively.
The governance coefficient from the joint-pillar model in Column (4) reports that a 10-point increase in governance score corresponds to a 1.4-basis-point reduction in loan spread. Relative to the sample-mean loan spread of 0.90 percentage points, this marginal effect accounts for approximately 1.56% of the average loan-spread level. This magnitude illustrates that firm-level governance characteristics carry meaningful economic weight when creditors set loan pricing.
The dominant role of governance aligns with credit-market logic: strong governance can strengthen internal monitoring and mitigate agency risk, reducing creditors’ expected default losses. Limitations remain due to high correlation across the three ESG pillars, which may reduce the precision of coefficients under the joint model. Hence, this finding reflect conditional correlations and cannot confirm governance as the only transmission channel.
In conclusion, the pillar analysis refines rather than replaces the baseline result: the aggregate association appears to be driven mainly by governance, while environmental and social scores provide weaker incremental explanatory power in the joint specification.
Empirical estimates of the relation between ESG performance and loan spread face several interference factors. First, reverse causality could arise: lower debt-financing costs may provide firms with extra resources for ESG investment, rather than ESG performance driving loan spreads. Second, omitted-variable bias is a concern. Unobserved time-invariant firm attributes, such as persistent corporate culture or inherent risk profiles, could jointly shape both ESG engagement and borrowing costs. Third, measurement concerns exist, as ESG rating metrics may contain factors that distort regression estimates. Table 6 addresses these concerns through a series of endogeneity tests. Section 5.1 – 5.4 will analyze table 6 in detail.
Column (2) adopts one-year-lagged ESG scores to establish a clear chronological order and mitigate reverse causality risk, since prior period ESG outcomes cannot be shaped by current year conditions. The coefficient on lagged ESG is -0.0011 and remains statistically significant at the 1% level, reducing concerns that contemporaneous loan spreads mechanically determine current ESG performance. Sample observations shrink from 9530 to 8041 when lagged ESG data are applied, as the first year record for each firm cannot obtain the prior year ESG score.
Column (3) includes firm fixed effects to absorb time-invariant firm-specific characteristics. This specification relies on within-firm time variation to explain unobserved attributes that could affect ESG performance and loan spread. The resulting coefficient equals −0.0013 and is statistically significant at the 1% level, suggesting that time-invariant firm characteristics do not fully explain the baseline association.
Column (4) presents the most rigorous model, which combines lagged ESG score with firm fixed effects. The coefficient remains negative (−0.0006) but turns statistically insignificant. This weaker result may reflect the smaller sample and limited within-firm ESG variation. Therefore, the tests alleviate some endogeneity concerns, but they do not establish a complete causal relationship.
Table 7 presents robustness tests examining whether the baseline ESG−loan-spread relation is sensitive to alternative variable measures, sample restrictions, and outlier treatment. The ESG coefficient remains negative and statistically significant when loan spread is log-transformed in Column (2). Column (3) shows that high-ESG firms have loan spreads that are approximately 4.25 basis points lower than those of low-ESG firms. The results also remain negative and statistically significant after excluding the 2008-2009 financial-crisis years in Column (4) and after winsorizing continuous variables in Column (5). Although the coefficients are not directly comparable across columns because the dependent variables and ESG measures use different units, their common direction and statistical significance indicate that the baseline conclusion is robust to these alternative empirical choices.
Taken together, the endogeneity and robustness tests provide broad support for the baseline negative association. The coefficient remains negative under lagged ESG, firm fixed effects, alternative dependent-variable and ESG definitions, sample restrictions, and winsorization. However, the lagged-ESG plus firm-fixed-effects specification is not statistically significant. Accordingly, the evidence alleviates several concerns and supports a robust association between ESG performance and loan spread, but it should not be interpreted as definitive causal identification.
This table presents tests designed to alleviate endogeneity concerns. Column (1) shows the baseline regression as a benchmark reference. Column (2) employs lagged ESG score to address reverse-causality risks. Column (3) incorporates firm fixed effects to absorb time-invariant firm-specific characteristics. Column (4) combines lagged ESG score and firm fixed effects to implement the most restrictive empirical model. In column (3) and (4), industry fixed effects are absorbed when firm fixed effects are included. t-statistics based on firm-clustered standard errors are reported in parentheses. *, **, and *** indicate significance at the 10%, 5%, and 1% levels, respectively.
This table evaluates the robustness of the baseline result to alternative variable definitions, sample restrictions, and outlier treatment. Column (1) repeats the baseline regression as a benchmark. Column (2) uses log-transformed loan spread. Column (3) replaces continuous ESG score with a high-ESG indicator. Column (4) drops observations from the 2008-2009 financial crisis. Column (5) uses winsorized ESG score to address extreme values. All specifications include firm-level control variables, year fixed effects, and two-digit SIC industry fixed effects. t-statistics based on firm-clustered standard errors are reported in parentheses. *, **, and *** indicate significance at the 10%, 5%, and 1% levels, respectively.
This study investigates the relation between corporate ESG performance and the cost of debt. Using 9763 firm-year observations from year 2002 to 2018, we find that higher ESG scores are associated with lower loan spreads after controlling for firm characteristics, year fixed effects, and industry fixed effects. The baseline regression result is supplemented by cross-sectional analysis, ESG pillar analysis, endogeneity tests and robustness tests to discover how ESG shapes loan-spread outcomes in detail.
The baseline regression results establish a robust negative association between corporate ESG performance and loan spreads. The coefficients remain statistically significant after adding firm-level control variables, year fized effects and industry fixed effects. The estimated economic magnitude is 1.4 basis points for a 10-point increase in ESG, equivalent to 1.56% of the mean spread. This finding demonstrates that ESG performance functions as a valid risk-related pricing factor in the debt market.
A series of extended tests reinforce the baseline finding. Cross-sectional tests show that ESG’s debt-cost benefit varies across firm-level attributes, verifying the risk mitigation mechanism in specific scenarios. When decomposing aggregate ESG into its individual pillars, the governance pillar dominates the overall negative relationship, while environmental and social dimensions yield weaker results. In the endogeneity test, although the most rigorous model combining lagged ESG and firm fixed effects turns insignificant due to limited within-firm variation and reduced statistical power, the overall evidence supports the reliability of the baseline association.
This study delivers meaningful implications for lenders, firm managers, and broader capital-market stakeholders. For bank creditors, the research findings indicate that stronger ESG performance can reduce credit risks, which supports the practice of offering more favorable loan terms to borrowers with good ESG records. For firm management, the debt cost advantages brought by ESG performances prompt enterprises to pursue sustainable initiatives and improve internal governance, since these measures help lower the financing costs. Beyond firm-specific considerations, the results also state that transparent ESG reports help lenders assess credit risk more accurately and facilitate more efficient capital allocation among borrowers.
This study remains several practical limitations. First, although the findings are broadly robust, the study cannot fully eliminate endogeneity and should therefore be interpreted as evidence of a robust association rather than definitive causality. Second, this study relies on commercial ESG rating data, which may contain inconsistent rating standards. Third, the sample is restricted to U.S. public firms, limiting the generalizability of the findings to private enterprises or cross-border markets. Future research may use more rigorous causal identification techniques, apply optimized ESG measurement indicators, and expand cross-country samples to examine the causal mechanisms more directly.
no relation:https://www.sciencedirect.com/science/article/abs/pii/S1057521922003325
social performance, governance performance and ESG performance have a positive and significant effect on the company's financial performance while environmental performance has a negative and insignificant effect on the company's financial performance